Generate a custom crime and security risk assessment for any address.


Generate a custom crime and security risk assessment for any address.
Your Business needs accurate crime risk data for any address.
For site selection. Security staffing. Underwriting risk. Investing in buildings. Negotiating leases. Targeting markets. These are all high cost, high risk decisions that you have to make.
Using the right tools means superior results with less work. The right tool is accurate crime risk information for specific addresses. Since crime risk often varies more from address to address within cities than it does between most cities, you can’t afford to risk your budget and company by using inaccurate and broad-brush city-wide, Zip Code, or census tract numbers. You need to know the risks for the address where your facility, customer, or insured is located. And you need the information to be instant, objective, and accurate.
You’ve come to the right place.
Until now, accurately quantifying crime risk for an address has been hindered by two prevailing impediments:
We address these issues in the pioneering approach SecurityGauge®uses to build its proprietary crime risk analytics. See how below.
Most city and town crime data are incomplete and inaccurate because crimes are reported by individual law enforcement agencies, rather than by city or town, and many cities – even small ones - have more than one agency responsible for law enforcement (municipal, university, county, transit, etc.). Even FBI data are reported by agency not by city or town, providing an incomplete assessment of city-wide crime counts. It is an agency-centric rather than locality-centric reporting method. If you use FBI data, you only get city-wide general counts, and only from one agency in the city, so it is generally incomplete for the city overall, as well as not specific to your site or address.
In addition, crime risk assessment across the nation is hindered further because the majority of law enforcement agencies in the United States do not geocode the specific locations of reported crimes, making it difficult to ascertain the locations and neighborhoods where most crimes occur in America today. Even when we know locations for crimes, the incidents have not been normalized based on resident and visitor population in the vicinity of an address, so risks simply cannot be accurately quantified.
SecurityGauge®solves these deficiencies with a new approach that delivers precision crime risk by address.
Start with Complete and Accurate Crime Counts
To address these issues, SecurityGauge®begins by collecting raw crime data from all 18,000 law enforcement agencies in America. Then we use a relational database built from the ground up to assign reported crimes from each agency to the city where it has law enforcement responsibility. This method provides an accurate representation of the complete number and types of crimes that are truly known to occur within any city or town.

One model does not fit all.
SecurityGauge®provides an instant, objective and quantitative assessment of property and violent crime risks for any address across the U.S. or Canada. We never use data on race, ethnicity, ancestry, language, or religion for any crime risk analytics.
SecurityGauge®gathers crime data from all U.S. and Canadian law enforcement agencies, organizes it in a custom-built database, and assigns reported crimes to their respective cities, offering an accurate overview of the actual types and numbers of crimes in any location.
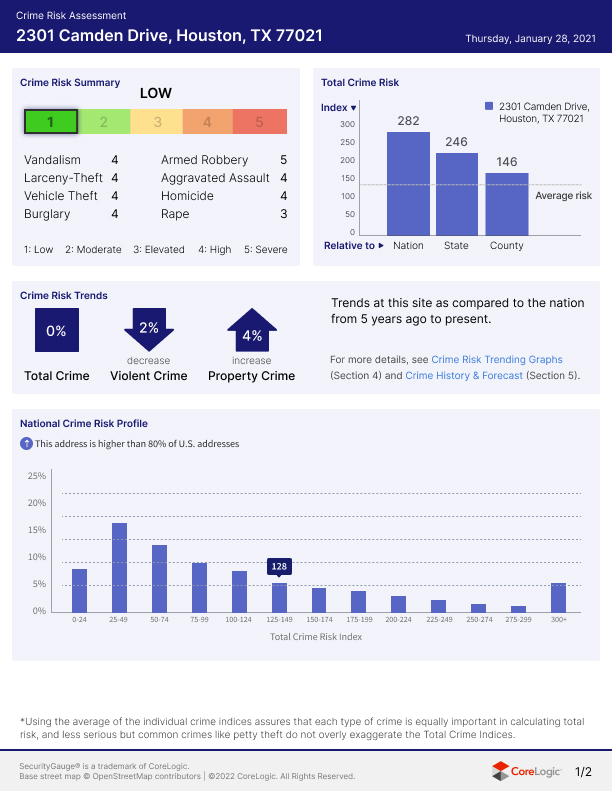
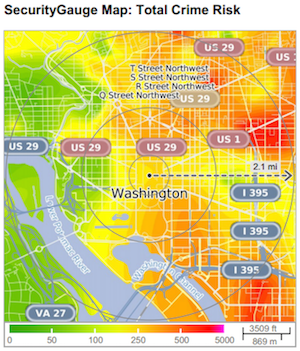
To provide an accurate snapshot of crime risk at any given location, SecurityGauge®has a unique methodology to ensure we provide the most precise crime risk analytics possible. SecurityGauge will drop a pin at your site and draw a large circle around the location. This circle will cover approximately 100,000 people or up to three miles from your location. We do this to ensure context and highly-accurate crime risk numbers. This circle emphasizes risk closer to your address and reduces emphasis with distance to best account for threats in your vicinity.
With this exclusive and comprehensive foundation of crime counts, SecurityGauge®then uses more than 80 proprietary computer models developed by its Ph.D. experts over nearly a decade of research to statistically predict the number and rates for every major type of crime for every community in America.

Traditional approach is to build one model and apply it everywhere.
We tested that. It doesn’t work. Places are different. Dynamics that create crime risk differ.
Just like one size fits all shoes aren’t great fits, so it is true of predictive models.
SecurityGauge®built more than 80 models to apply to clusters of locations.
National Validation = Precision.
Since we know the numbers of reported crimes that actually occur in each community because of our exclusive approach, we are uniquely able to validate our models against the only comprehensive location-centric crime database in the U.S. and Canada with complete national coverage.
Superior spatial depth - 10 meter resolution
With validated precision models for every major crime type, SecurityGauge®builds crime risk data for nearly a quarter of a million neighborhoods all across the U.S. and Canada. This forms a dense net of crime data that is input to our spatial risk models resulting in a national database of 10 meter resolution crime risk data for the entire U.S. and Canada.
Your custom crime risk calculation is generated on demand from this data and is based upon a distance weighted cone of influence around any specified address. The crime risk calculation is weighted most heavily nearest the address and lessens as it progresses outward, depending on distance and population.
This is because crime risk can be visited on your site not only from the risk at your door, but by risks in your vicinity where threats may emerge. So in dense cities, the cone of crime risk influence on your address is closer to your site, as it should be. In suburban or rural areas, the cone of influence is allowed to extend further outward.
Values are calculated based upon a distance weighted cone of influence around any specified address. The cone of influence is divided into three rings which are plotted on all Crime Maps.
Complete National Coverage
SecurityGauge®provides the same level of precision and accuracy for every address in America. All 50 states and DC, Puerto Rico, and US Virgin Islands.
No redlining. Ever.
SecurityGauge®never uses data on race, ethnicity, ancestry, or language for any of its crime risk analytics. Much like other spatially expressed risks such as flood, earthquake and hail, SecurityGauge predicts the risk of being a victim of a crime at an address, and is not an indicator that an individual is likely to participate in criminal behavior. In fact, SecurityGauge uses no information on the household or housing structure at the address as part of the crime risk assessment. Rather, it is the risks that can be visited upon the address due to its location and proximity to conditions proven to generate higher crime risk. One may be in a high crime risk location, just like one may be in a high risk location for flood, earthquakes, hail or other hazards. Race is not a factor which is relevant to assessing crime risk, just like it is not relevant to assessing these other risks.
Because it is not relevant, SecurityGauge does not include any information on race, ethnicity, ancestry or language, and SecurityGauge treats all locations equally when the locations are comparable in all respects relevant to crime risk.
Get Started Now